Open Knowledge Maps : a visual interface to the world's scientific knowledge
28/03/2017
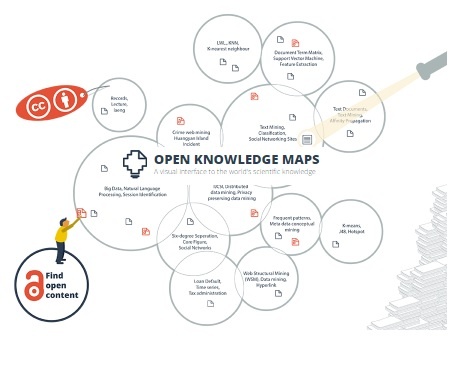

Open Knowledge Maps (OKMaps) is a visual interface to the world’s scientific knowledge. The base for this interface consists of so-called knowledge maps, a powerful tool to explore a research field and to increase the visibility of research findings for science and society alike.
___________________________________________________________________________________________________
OKMaps - a visual interface to the world's scientific knowledge - follows the motto "open science, all the way". The idea of OKMaps goes back to the Panton Principles for Open Data in Science, and with mentoring from the Open Leaders program.
From OKMaps roadmap (an API is part of OKMaps roadmap) to OKMaps source code and OKMaps data, everything on OKMaps is published under an open license.
|
All content on OKMaps is licensed under a Creative Commons Attribution 4.0 International License. OKMaps software is open source and hosted on Github. See OKMaps repositories at OpenKnowledgeMaps. |
Why OKMaps?
|
Get an overview of a research topic |
Knowledge maps provide an instant overview of a topic by showing the main areas at a glance, and papers related to each area. This makes it possible to easily identify useful, pertinent information. |
|
Separate the wheat from the chaff |
OKMaps clusters similar papers together. This makes it easier to identify relevant content when you are searching for an ambiguous term, or when you would like to identify content from a single discipline in a multidisciplinary field. |
|
Identify relevant concepts |
One of the most difficult tasks when you are new in a field is to learn the “language” of the field. OKMaps makes it easier for you by labelling research areas with relevant concepts. |
|
Find open content |
OKMaps highlight open access papers - and the majority can be read from within the interface. And if not, the full-text is only a click away. |
OKMaps is now connected to
one of the largest academic search engines in the world: BASE. Support in making this happen is also attributed to rOpenSci tools that allow access to data repositories through the R statistical programming environment.
How OKMaps works:
|
1. |
An OKMaps visualization presents you with a topical overview for your search term. It is based on the 100 most relevant documents for your search term. |
|
2. |
OKMaps uses text similarity (using titles, abstracts, authors, keywords and publication venue as input for the similarity matrix) to create the knowledge maps. The algorithm groups those papers together that have many words in common. |
|
3. |
The visualization is intended to give you a head start on your literature search. You can also use OKmaps to stay up-to-date - just limit your search to the most recent papers in the options. |
With OKmaps you are able to visualize a research topic from 100+ million documents. And for the first time, you can now search within different types of resources, including datasets and software.
The new release of the OKMaps provides improved naming of the sub-areas to make the concepts in a field more visible - which means that this update improves the existing PubMed integration too.
OKMaps welcomes (write at: [email protected]) any feedback you may have!
___________________________________________________________________________________________________
Source: Open Knowledge Maps
Related content: The Open Data Commons provides a set of open data licences that enable organisations and individuals to make their data legally open - free for anyone to use, reuse, and redistribute.